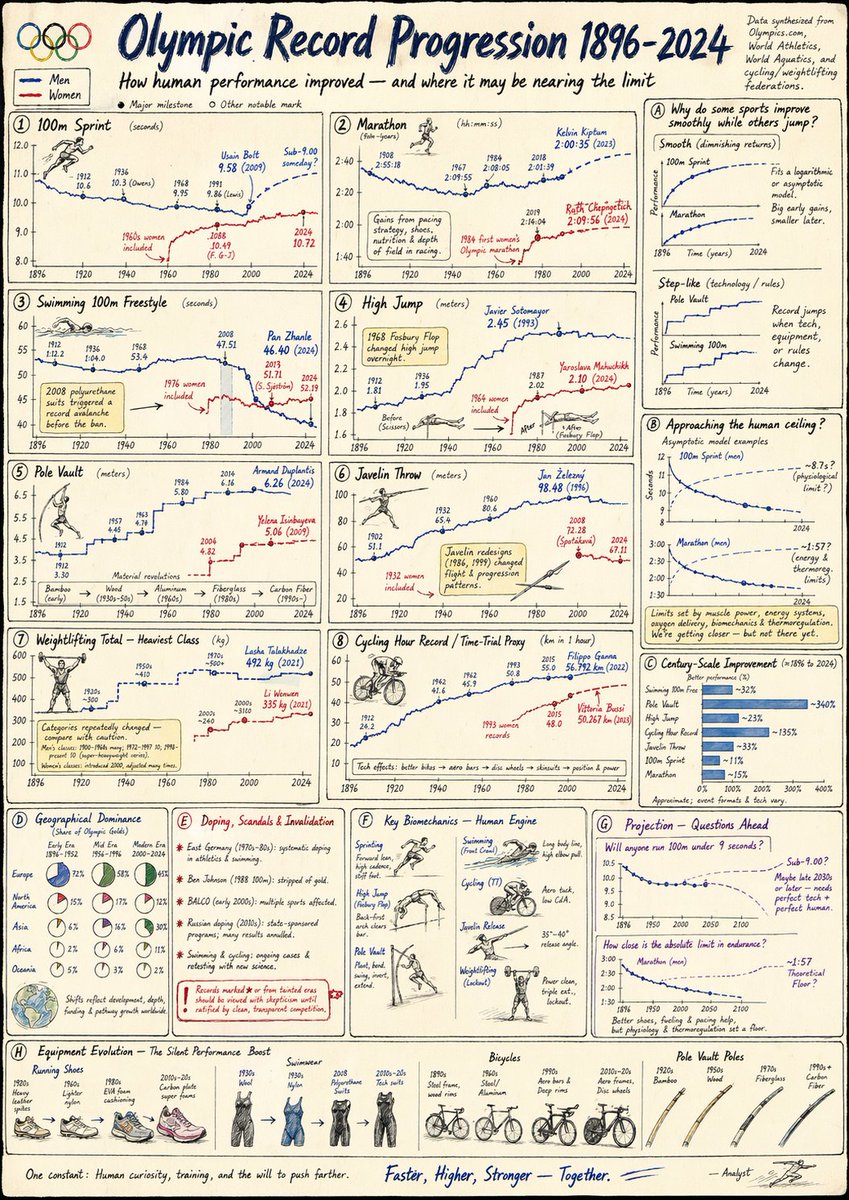
[Create a dynamic sports analytics infographic on cream paper tracking world record progression in 8-10 Olympic events (100m sprint, marathon, swimming 100m freestyle, high jump, pole vault, javelin, weightlifting, cycling time trial). For each event, draw a detailed historical trend line from the first modern Olympics (1896) to 2024, showing how records improved over time. Hand-sketch each line with dates of major breakthroughs marked with dots and annotated with athlete names written casually. Use different colored inks for men's and women's records (introduced later for most events). ANALYTICAL COMPONENT: Add scientific analysis panels examining improvement patterns: "Why do sprint times follow logarithmic improvement curve while pole vault shows step-function jumps?" Draw curve-fitting overlays showing mathematical models (exponential decay approaching theoretical limits). Include technology impact callouts: "1968 Fosbury Flop technique changed high jump overnight" with before/after technique sketches, "2008 polyurethane swimsuits broke 108 records before ban" with timeline showing the spike. Create supplementary analysis: hand-drawn bar charts comparing improvement rates across sports (swimming: 32% faster vs. marathon: 15% faster over 100 years). Add physiological limit discussion: "Are we approaching human performance ceiling? Examining asymptotic curves." Draw small biomechanics diagrams explaining technique evolution. Include geographical dominance shifts: pie charts showing medal distribution by continent across different eras. Add doping scandal impacts with notation of invalidated records. Create projection curves: "Will anyone run 100m under 9 seconds?" with statistical extrapolations sketched in lighter ink. Include equipment evolution illustrations: running shoe technology timeline, bicycle aerodynamics improvements, pole vault material changes (bamboo → fiberglass → carbon fiber). Data from Olympics. com, IAAF, FINA. Hand-drawn with sports illustration energy - dynamic action pose sketches, motion lines, organic pen work, athletic aesthetic.]